Sinochem International Corporation (SHA:600500)
 China
· Delayed Price · Currency is CNY
China
· Delayed Price · Currency is CNY | Market Cap | 16.95B |
| Revenue (ttm) | 49.15B |
| Net Income (ttm) | -3.65B |
| Shares Out | 3.58B |
| EPS (ttm) | -1.04 |
| PE Ratio | n/a |
| Forward PE | n/a |
| Dividend | n/a |
| Ex-Dividend Date | n/a |
| Volume | 77,647,140 |
| Average Volume | 54,225,472 |
| Open | 4.890 |
| Previous Close | 4.790 |
| Day's Range | 4.680 - 4.930 |
| 52-Week Range | 3.460 - 4.930 |
| Beta | 0.80 |
| RSI | 58.99 |
| Earnings Date | Apr 18, 2026 |
About Sinochem International
Sinochem International Corporation engages in the intermediates, new materials, polymer additives, and natural rubber businesses worldwide. The company offers pesticide intermediates, electronic chemicals, and pharmaceutical intermediates; and ultraviolet absorbent, light stabilizers, polymerization inhibitors, and antioxidants. It also offers epoxy resin, including fibers, membrane, and lightweight materials. In addition, the company provides lithium batteries and materials. Further, it engages in the research, production, and sale of pharmace... [Read more]
Financial Performance
In 2024, Sinochem International's revenue was 52.93 billion, a decrease of -2.48% compared to the previous year's 54.27 billion. Losses were -2.84 billion, 52.2% more than in 2023.
Financial StatementsNews

China's top diplomat Wang Yi to visit Italy and Switzerland this week
Top Chinese diplomat Wang Yi will visit Italy and Switzerland from October 7 to 12, according to China's foreign ministry. Wang would attend the 12th joint meeting of the China-Italy government commit...
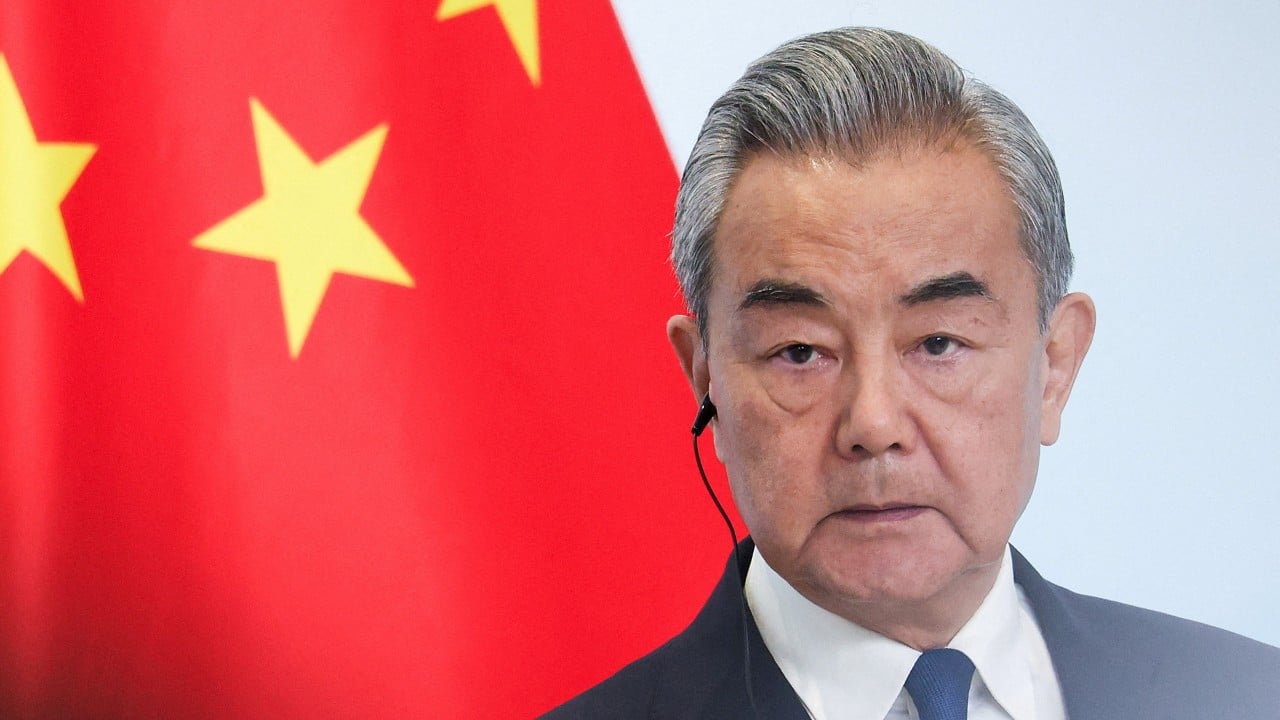
China’s top diplomat Wang Yi to visit Italy, Switzerland: foreign ministry
Beijing’s top diplomat, Wang Yi, is scheduled to visit Italy and Switzerland from Tuesday until October 12, China’s foreign ministry said on Sunday. Wang would attend the 12th joint meeting of the Chi...